
Introduction
Many traders agree that the key to success in forex trading is to put together a suite of technical indicators that help monitor what is going on in the markets and identify trends that you need to act on. The Stochastics indicator is one such tool, often used in conjunction with other indicators to help confirm price behaviour in the forex markets.
The Stochastics indicator is a popular member of the oscillator family of technical indicators that essentially attempts to track and forecast overall price trends. It was created by George Lane, who observed that as markets reach a peak, the closing prices tend to approach the daily highs and vice versa. The Stochastics indicator is considered a leading indicator as it aims to generate signals before they appear in pricing behaviour. The indicator can be used in any market, including the forex market, and is commonly used by traders aiming to identify overbought and oversold conditions, indicating the beginnings and endings of cycles in the forex market.
The Stochastics indicator attempts to convey pricing momentum direction changes. Typical oversold and overbought conditions are noted on the chart, and line crossings confirm these trading signals. Divergences are also important as they can indicate that prices are reaching new highs, but the Stochastics lines are already receding from previous highs, which can be seen as a sign to sell or short.
In this article, we will examine how the indicator works, how it is calculated, and how it can be used to identify opportunities in forex trading. We will look at Stochastics indicator forex strategies and suggest examples of how exactly the indicator might create a buy or sell signal, given a particular set of market circumstances.
HOW IS THE STOCHASTICS INDICATOR CALCULATED?
It’s important to remember that the Stochastics indicator presents the location of the closing price of a stock in relation to the high and low range of the price of a stock over a period of time, which is typically 14 days but can be customised to other timeframes. The indicator’s inventor, George Lane, has made it clear that Stochastics is not designed to follow price or volume, but rather to track the speed or momentum of price movements.
To understand how this indicator works, we can look at exactly how the calculations are made. Stochastics consist of two lines formed by “%K” and “%D”, which are analysed by the indicator to identify overall trends. The Stochastics indicator uses a calculation formula sequence that involves these steps:
- Choose a period “N” for “%K”, “X” for %D (Standard settings = 9,3)
- %K = 100 * (CCL – LN)/(HN – LN) where CCL = current closing price, LN = lowest low of past “N” periods, HN = highest high of past “N” periods
- %D = 100 * (HX /LX) where HX = X-period sum of (CCL – LN), LX = X-period sum of (HN – LN)
In simple terms, the Stochastic indicator is calculated by subtracting the low for the period from the current closing price, dividing by the total range for the period and multiplying by 100. Be aware that:
- CCL = current closing price
- LN = lowest low of past “N” periods
- HN = highest high of past “N” periods
The trader chooses the period, based on the type of trading being done and the period of time that needs to be studied. Once you have added the necessary data, software algorithms perform the computational work and produce a Stochastics indicator which is displayed on a chart.
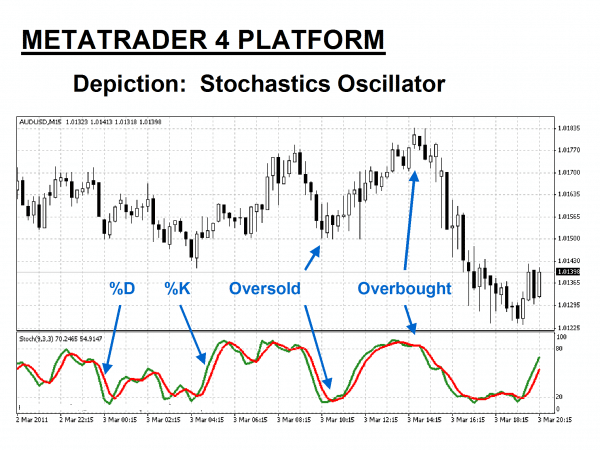
The Stochastics indicator is composed of two fluctuating curves – the “Green” %K line, and the “Red” %D signal line. Forex traders prefer a slower version of this indicator because they believe the signals are more accurate. For Slow Stochastics, %K becomes the old %D line, and the new %D is derived from the new %K.
HOW TO USE THE STOCHASTICS INDICATOR IN FOREX TRADING
The stochastic indicator might seem complex, but it is actually a very user-friendly indicator. It is included in most charting and technical analysis programs and can be accessed through the commonly used MT4 forex trading platform.
The standard time period used with the Stochastics forex indicator is 14 days, but this can be customised to meet the needs of individual traders, who might wish to study a much shorter, or longer period. By comparing the current price to the range over time, the stochastics indicator analyses how consistently the closing price is close to a recent high or low price. This helps traders determine if a position is overbought or oversold.
As we have already discussed, the process involves subtracting the low for the period from the current closing price, dividing by the total range for the period and multiplying by 100. For example, if the 14-day high is $150, the low is $125 and the current close is $145, then the reading for the current session would be:
(145-125) / (150 – 125) x 100 = 80
Forex traders focus on the Stochastics key points of reference, which include high points, low points, divergences and sometimes crossovers, looking for buy and sell signals, and often confirming them with other technical indicators before acting. As with most technical analyses, skill in interpreting and understanding Stochastics indicator signals only comes with experience and must be developed over time.
When using the Stochastics forex indicator, it is important to remember that, as with any technical indicator, a Stochastics chart will never be 100% correct in the signals that it presents. Technical indicators are not infallible. Depending on market conditions, indicators will sometimes present traders with false signals. Over time, however, the signals are usually consistent enough to give a forex trader an edge, when it comes to making profitable trades.