
INTRODUCTION
The Simple Moving Average (SMA) indicator is one of the oldest and most common technical indicators used across all financial markets, including the forex market. It is essentially used to smooth out the effects of price volatility and create a clearer picture of changing price trends over time. Traders sometimes use an SMA alongside another SMA for a different period to confirm a change in the price behaviour of a particular asset.
Moving average strategies are popular with both long-term investors and short-term traders, as they can be easily tailored to any time frame. An SMA indicator can be set to monitor price trends over a period specified by the trader, whether 20 minutes, 100 days or 30 weeks.
In this article, we will look at how to use an SMA, how the indicator makes calculations and how the calculations look on a price chart. We will also examine how an SMA indicator can help a trader to identify trading opportunities and how to develop a simple SMA indicator trading strategy.
The first thing to know is that using an SMA stock indicator is relatively straightforward. The indicator has only two variables: period and price. The period can be set at any number, but values over 20 are advised when trying to identify longer-term trends. The price can be set at opening, closing, high, or low. The SMA indicator can also form a support or resistance line, depending on the type of trend identified that traders could incorporate into their decision-making process and trading strategy.
A simple moving average indicator can be very useful and provide any type of trader with important buy and sell signals. However, as with any technical indicator, there are disadvantages to using a simple moving average. As with many trading tools, the SMA is based on historical data to date. There is nothing predictive in the way calculations are made, so the system is far from infallible as a way of forecasting future price action.
In times of high volatility, when an instrument experiences many price changes over a short period, the price will swing back and forth, potentially generating multiple trade signals. When using the crossover strategy (outlined below), the moving average lines can become ‘tangled’ for a short period, again triggering multiple trading signals.
It is then vital that any trader using an SMA indicator understands how it works and recognises its limitations. A simple moving average strategy frequently relies on checking other trend indicators for confirmation and monitoring fundamentals that can impact the market in which you are trading.
HOW IS THE SIMPLE MOVING AVERAGE INDICATOR CALCULATED?
An SMA indicator uses a calculation formula that simplifies pricing information by averaging it out over a specific period, which the trader specifies. The Simple Moving Average is calculated by adding the price of an instrument (for example, the opening price or the closing price) over a specified number of time periods and then dividing that sum by the number of periods. As the name implies, it is a way of simply finding the average price of an instrument over any set period.
An SMA indicator uses software programs to perform the necessary calculations. The simple moving average formula produces a gradually changing line imposed over the top of the price chart. As already mentioned, two separate simple moving averages can be used to compare the average price of an instrument over different periods.
You can choose any time period for a moving average, but typical lengths of time are 10, 20, 50, or 100. These periods can be based on any time frame that the chart you are using allows (so it could be a minute, a day, or a week, for example). Day traders will pick shorter time periods and long-term investors, longer ones. The time frame or length you choose is also referred to as the “look back period”.
Keep in mind that an SMA indicator set to monitor a short time frame will react much quicker to price changes than one with a more extended period set, so with shorter time frames, the SMA will more closely track the actual price than with longer time frames. Having said that, with very short periods, pricing information may be limited, potentially creating a false signal, so there are both pros and cons to using an SMA indicator for shorter or longer-term trading. The SMA is one specific form of trend indicator, but the concept also forms the basis for other technical indicators such as the moving average convergence divergence (MACD).
The SMA indicator is usually imposed over the existing candlestick formations on the chart. However, traders can also add the SMA to another indicator window, such as the RSI, to provide additional trading signals. The value of the SMA indicator is in its visual simplicity. Traders can quickly assess the prevailing trend of price behaviour from the direction of the SMA.
It must be remembered that the SMA is a lagging indicator, so it may not adjust rapidly to volatility in the market. This is also why the SMA is considered a good tool to use over more extended time periods. When shorter periods are chosen, there may not be enough pricing information to create a reliable result, which may increase the possibility of false signals.
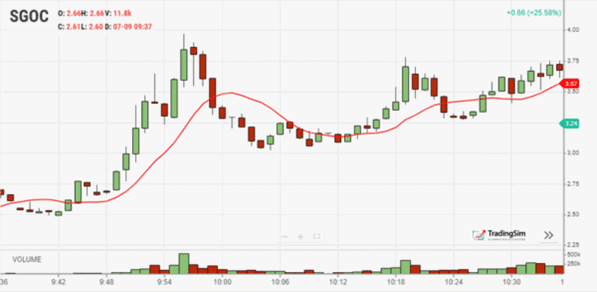
Image from Trading Sim
HOW TO USE THE SIMPLE MOVING AVERAGE INDICATOR IN FOREX TRADING
To use an SMA Indicator, you will need first to choose the setting for your variable. As already mentioned, there are only two: period and price. For period, you will choose a value, such as 30, and for the price setting, you could choose the opening price or closing price, or perhaps the high or low price, for each period. If you choose ‘30’ and ‘closing price’, the indicator will add up the sum of the closing price on each of the last 30 time periods and divide it by 30.
An SMA indicator is most useful when a strong trend is present over a long period. The key points of reference that traders pay attention to are when the SMA crosses over the pricing candlesticks. If prices are going up and a crossover occurs, that is viewed as a buy signal. If prices are decreasing and a crossover occurs, that is generally interpreted as a sell signal.
As with any technical indicator, an SMA chart will never be 100% accurate. False signals can occur, but the positive signals are consistent enough to give any forex trader an edge. Skill in interpreting and understanding SMA alerts can be developed over time, and complementing an SMA indicator with other technical indicators, such as a moving average convergence divergence (MACD), is a good idea. Using multiple technical indicators in tandem is always recommended, as the different ways of assessing trends will help further confirm potential price changes or cast doubt on potential trends.