
INTRODUCTION
The “Relative Strength Index” or “RSI” indicator is a popular member of the “Oscillator” family of technical indicators. J. Welles Wilder Jr. created the RSI to measure the relative changes that occur between higher and lower closing prices. Traders use the index to determine overbought and oversold conditions, valuable information when setting entry and exit levels in the forex market.
Mr Wilder was born in America in Norris, Tennessee, in 1935 and only recently passed away in 2021. He was a mechanical engineer and real estate developer by trade, but he is revered for his many contributions to the field of Technical Analysis. The RSI is, perhaps, his most popular indicator, but he also fathered the Average True Range, the Average Directional Index, and the Parabolic SAR. Forbes Magazine acknowledged him in 1980 as “the premier technical trader publishing his work today”. His advice: “If you can’t deal with emotion, get out of trading.”
To heed his advice, you need to be disciplined and stick to a strategy based on indicators like the RSI. The RSI is classified as an oscillator since the resulting curve fluctuates between values of zero and 100. The indicator typically appears at the bottom of a chart and has lines drawn at both the “30” and “70” values denoted on the right border as warning signals. Values exceeding “85” are interpreted as a strong overbought condition, or “selling” signal, and if the curve dips below “15”, a strong oversold condition, or “buying” signal, is generated.
As with other oscillators, the RSI indicator attempts to measure how quickly and by how much the pricing movements of your chosen asset are changing in the market. The thinking is that investors will typically overshoot the mark when prices rise or fall, thereby presenting an opportunity to benefit from the psychology of other investors. The RSI posits that the way to detect this situation is to calculate the ratio of higher closes to lower closes. Coupled with another indicator and recognisable patterns, the Relative Strength Index can be a powerful tool.
HOW IS THE RSI INDICATOR CALCULATED?
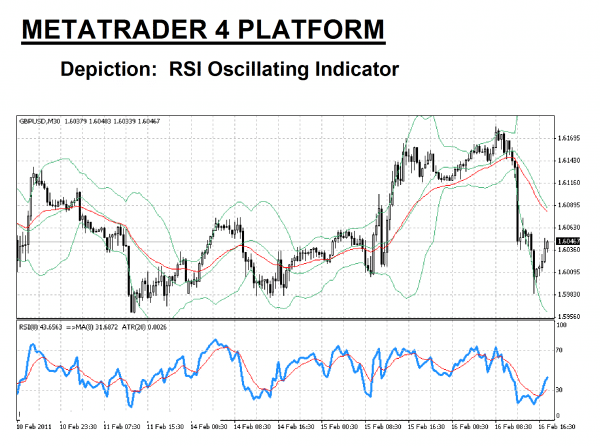
The RSI indicator is composed of a single fluctuating curve. Traders will occasionally add an exponential moving average, as above in red, to enhance the value of the trading signals. In the example above, the “Blue” line is the RSI, while the “Red” line represents an “EMA” for the same period variable of “8”. The RSI is viewed as a “leading” indicator in that its signals foretell that a change in trend is imminent. The weakness in the indicator is that timing is not necessarily a product of the RSI, the reason for attaching a “lagging” moving average to confirm the RSI signal.
The RSI indicator is common on MetaTrader4 trading software and is often a standard issue for even the best proprietary trading platforms. The calculation formula sequence involves these three straightforward steps:
- Choose a predetermined period “X” (Standard value is “14”, although a value of “8” or “9” tends to be more sensitive.
- Calculate “RS” = (Average of “X” periods up closes/Average of “X” periods down closes.
- RSI = 100 – [100/(1 + RS)].
Wilder introduced the Relative Strength Index indicator in 1978 in his book, New Concepts of in Technical Trading Systems, well before the advent of personal computers. Did Wilder prepare his calculations manually, or did he rent computer time? The answer does not matter in our time because software programs in today’s modern trading platforms perform the necessary computational work and produce an RSI indicator, as depicted in the chart shown above.
Like many other veteran traders of his time, Wilder had scars from trying to anticipate changes in the price direction of a particular asset. He wanted something that would give him an edge as to when a pricing reversal was imminent. He devised a formula using previous pricing data to predict when a market was oversold or overbought, not necessarily the bottom or top, but an indication that, within a short period, the peak or valley might appear.
The popularity of the RSI was immediate. Wilder also spoke to many subtle nuances in how the movements in the RSI could be interpreted in addition to the fabled oversold and overbought situations. Other analysts have also shared their insights over time on mid-line insights and divergences, together with the basic tenets of the indicator. As always, however, the RSI is not perfect. The traditional period setting of “14” can be modified, yielding a more sensitive gauge, accompanied by false-positive signals, as well.
Wise traders understand that one indicator cannot be the “Holy Grail”. However, one can provide insights. A complementary indicator can provide further confirmation. When combined with candlesticks, pattern recognition, and levels of support and resistance, a powerful RSI strategy can be developed, producing better than average results over time. The main point is to practice trade and get familiar with this indicator and its nuances. Veteran traders always swear by their practice sessions as a way to “deal with emotion”, per Mr Wilder.
HOW TO USE THE RSI INDICATOR IN FOREX TRADING
Wilder had his own opinions about the signals that his innovative indicator produced. He was not content to look at only instances where the RSI crossovers occurred, which would signal a possible oversold or overbought condition. He and others also viewed the 50% line as a place where intuitive insights could be gleaned. Lastly, the issue of divergence is another focal point in these studies, those areas where the RSI is acting contrary to the current price action. Lastly, Wilder believed his RSI indicator could also telegraph signals independently of pricing behaviour. Other analysts have expanded on this concept as RSI bullish/bearish trends.
Let’s look at the conclusions that others have made once they felt that the RSI indicator explained where pricing behaviour was destined to go in the short term:
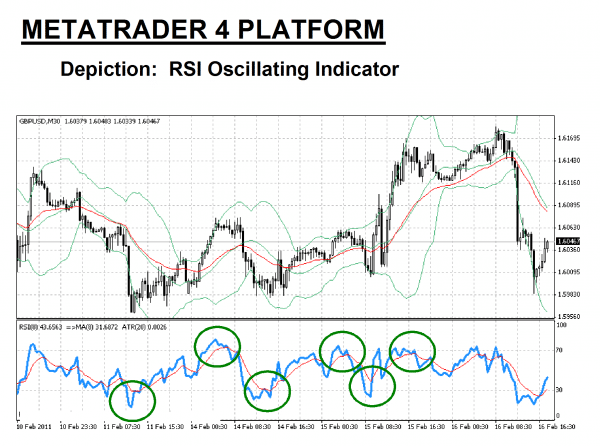
- Crossovers: The most common attribute of the RSI that beginners latch onto without further inspection is the crossover of the 30/70 thresholds. The six “Green” circles in the chart below highlight these focal points, the lower ones signalling oversold and the upper denoting overbought conditions. If we choose the third circle as an example, the crossover occurred well before the impending uptrend.
- Mid-range signals: Wilder wrote much about his RSI demonstrating support and resistance levels, especially about the “50%” mid-line. When the RSI is tracking below “50%”, the message is that the asset’s losses are greater than its gains. When the RSI trends above the “50%” mid-line, the opposite is true – gains are exceeding losses.
- Divergence: This phenomenon occurs when price action is headed in one direction, yet the slope of the RSI is running contrary to that direction. Look at the chart from the sixth green circle to the right, and then observe the divergence, which takes place over the next few time periods. The slope of the RSI action is negative, while the accompanying price action is positive. The RSI is alerting the trader to a potential decline.
- Bullish/Bearish trends: It is easy to speak to the studies of several analysts that point to special situations with the RSI, but whether they are called trends or swings is not the issue. Observe from the third green circle to the right. It is a bullish trend except for one moment when the RSI crosses the “30” threshold. For the bullish trend, the RSI then hovers above the “40” line for the duration of the trend. For a bearish trend, the opposite reaction of the RSI can be observed.
It does not matter what classification you wish to put on an observance of the RSI reacting to real-time price behaviour. The primary takeaway is that it takes experience, typically gained through a disciplined practice regimen, to learn the nuances of this powerful tool. In the following sections, we will suggest how to build a strategy around the RSI indicator and then show an example.