
The use of indicators in Technical Analysis (TA) has a long history of development and success to the chagrin of fundamentalists and academics. As with forces in nature, financial markets tend to move in waves as prices gyrate back and forth in search of a balance between buyers and sellers of the chosen instrument. As a rule, under these circumstances, prices also tend to overshoot their targets or overextend their current trends. A special class of indicators was created to focus on these oversold and overbought moments in pricing behaviour. These indicators go by the name of “Oscillators”, and the Momentum Indicator (MOM) is just one of many to be found in this classification. Oscillators are also helpful when no visible trends are present during extended ranging periods. Slight price changes when inserted in the indicator formula can still reveal the presence of a trading opportunity.
Oscillators are based on changes in price that are measured in a specific way to produce insights and typically follow a set of three rules:
- Alerts at the extremes, i.e., oversold or overbought conditions, are the most useful.
- Secondary signals can be triggered when the oscillator and price diverge in different directions.
- Oscillators have a mid-line, sometimes displayed as a zero line, and the crossing of this midpoint can also be a useful signal that directional changes are imminent.
The Momentum Indicator is another member of the Oscillator family of technical indicators. The creator of the Momentum Indicator is unknown, but Martin Pring has written much about the Indicator. It attempts to measure the momentum behind price movements for the underlying currency pair over a period. Traders use the index to determine overbought and oversold conditions and the strength of prevailing trends.
The Momentum indicator is classified as an oscillator since the resulting curve fluctuates between values about a centreline, which may or may not be drawn on the indicator chart. Overbought and oversold conditions are imminent when the curve reaches maximum or minimum values.
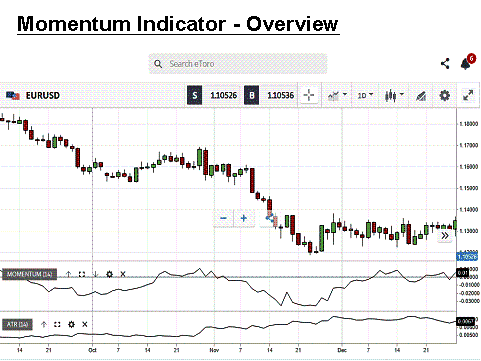
However, the word “momentum” is a general term in trading parlance. There may be some confusion when searching for this indicator since there are two versions in use. The overview chart shown above is courtesy of eToro. Its proprietary charting system displays Version 1, a simple representation that subtracts the current closing price from the closing price from 14 periods back.
On the MetaTrader 4 trading platform, the Momentum Indicator is Version 2, where the rate of change in prices is calculated as a percentage rather than a simple difference. Details for calculations for both versions are discussed in the next section, but MT4 traders often add a Smoothed Moving Average with the indicator to improve signals for imminent trend changes. MT4 offers a Momentum Modulator Indicator histogram that visually highlights trends, as well.
Forex traders focus on the Momentum critical points of reference: extreme highpoint and low-point values. Mid-point crossovers and pattern divergences also give secondary clues. As with any technical indicator, a Momentum chart will never be 100% correct in the signals that it presents, but the signals are consistent enough to give a forex trader an edge. Tilting the odds in your favour over time is a winning strategy for success.
To develop skills in interpreting and understanding Momentum indicator signals, practice sessions on a free demo trading system are highly recommended. Experience gained during such sessions will enhance your ability to recognize and profit from favourable trading setups. The Momentum Indicator, however, should never be used in isolation. Experiment with other indicators, patterns of recognition, or indicative levels of strength and resistance to acquire additional confirmation for your actions.
HOW IS THE MOMENTUM INDICATOR CALCULATED?
The concept of measuring the momentum behind a trend is not a new one. The primary objective is to determine the rate of change in prices in such a way that the tracking of this variable will reveal the strength of the trend under review. A change in momentum is evidence that investor moods are shifting, which may soon morph into a change in pricing direction.
There are more than a handful of very capable momentum indicators, but the “MOM” studied here is the more basic of the group with two variations that proliferate most trading platforms. There are also more complex versions of momentum oscillators. The Relative Strength Index (RSI) and the Moving Average Convergence Divergence (MACD) are two popular ones that top most lists. Each one is designed to measure the strength or weakness of current pricing behaviour.
The MOM is presented beneath the chart data in a separate box of its own. The basic rule is that if the indicator is rising, momentum is building behind the uptrend at hand, and visa-versa for a downtrend. Divergences, the times when prices and the indicator go in opposite directions, are the exception to this rule and can be helpful. However, unlike the popular RSI, there are no upper and lower boundaries or specific levels that indicate oversold and overbought territory.
The beauty of today’s trading platform software is that no matter how complex the calculation for an indicator might be, the software performs the computations in real-time, allowing the trader to spend the time evaluating the correctness of the signals given. Presented below are the details for how each version of the MOM is calculated:
Version 1 (Rate of Change as a difference):
- Choose a predetermined period “X” (Standard value is “14”, although a value of “8” or “9” tends to be more sensitive).
- Calculate “Close1” as the closing price for the current bar.
- Calculate “CloseX” as the closing price “X” bars ago.
- MOMENTUM = “Close1” -” CloseX”.
Version 2 (Rate of Change as a percentage):
- Choose a predetermined period “X” (Standard value is “14”, although a value of “8” or “9” tends to be more sensitive).
- Calculate “Close1” as the closing price for the current bar.
- Calculate “CloseX” as the closing price “X” bars ago.
- MOMENTUM = 100 X (“Close1”/”CloseX”).
How do you tell which version is applied to your chart? If you look at the chart presented in the Introduction, you will see a scale on the right side of the indicator box that depicts values, both positive and negative, about a zero mid-line. Since Version 2 is a percentage ratio, the scale will reflect values both above and below a value of 100%. An example of Version 2 is presented below:
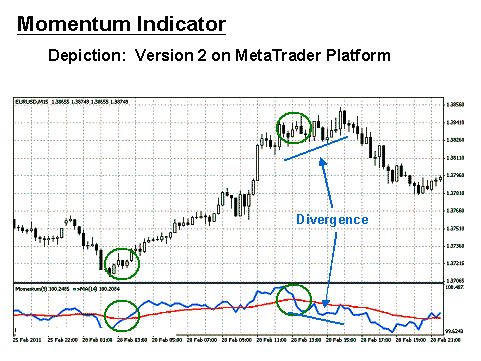
For this chart depiction of the EUR/USD currency pair, the Momentum scale to the right ranges from 99.6 to 100.5. A period setting of “9” is presented on the bottom portion of the above “15 Minute” chart for the MOM. The Momentum indicator is composed of a single fluctuating curve. Traders will occasionally add a Smoothed Moving Average, as above in “Red”, to enhance the value of the trading signals. In the example above, the “Blue” line is the Momentum, while the “Red” line represents an “SMA” for “14” periods.
The Momentum Indicator is viewed as a “leading” indicator in that its signals foretell that a change in trend is imminent. The weakness in the indicator is that timing is not necessarily a product of momentum, the reason for attaching a “lagging” moving average to confirm the Momentum signal. The Momentum Indicator is regarded as an excellent gauge of market strength. A shorter period setting will create a more sensitive indicator but will increase choppiness and the potential for increased false signals.