
Introduction
In this article, we will explain what is a demarker indicator, how it can help traders identify trading opportunities, and provide an example of a Demarker trading strategy to help you identify trades and when to enter and exit a trade.
The DeMarker or “DeM” indicator is another member of the “Oscillator” family of technical indicators. Thomas Demark created the DeM in an attempt to measure the demand for the underlying currency pair. The DeM indicator relates recent price action to recent price ranges. Traders use the index to determine overbought and oversold conditions, assess risk levels, and time when price exhaustion is imminent. It has become a helpful tool to gauge the directional trend of the market since it tends to level out during a trend before signalling a coming change.
Thomas Demark was a prolific writer and businessman in the United States who cut his teeth as an officer of National Investment Services, a manager of multi-billion-dollar pension funds. In 1982, he formed an investment advisory firm, DeMark Investment Advisory, serving major clients like George Soros, Goldman Sachs, and IBM. He is best known in the forex trading industry as a supplier of specialised software to support market-timing regimens, developing over 70 tools during his 50-year career. Over the same period, he authored several books on market-timing techniques. In 2020, he was awarded a Lifetime Achievement Award by the Market Technicians Association.
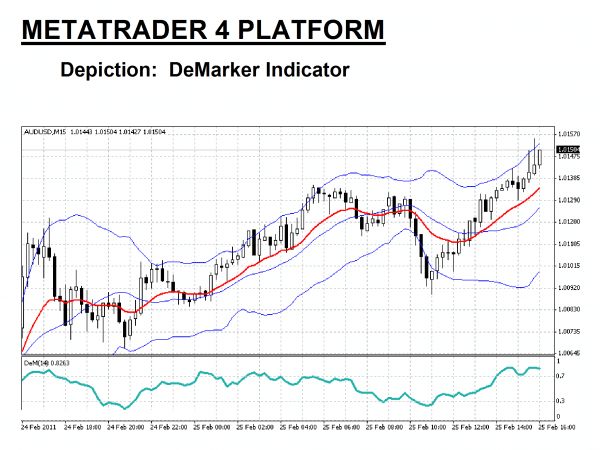
The DeM indicator with a period setting of “14” is presented on the bottom portion of the above “15 Minute” chart for the “AUD/USD” currency pair. In the example above, the “Green” line is the DeM, while the “Red” line, added as an additional option on the MetaTrader 4 platform, represents an exponential moving average for fourteen periods. DeMarker values below 0.30 and over 0.70 are worthy of attention. Bollinger Bands have also been added for more confirmation.
The DeMarker is classified as an oscillator since the resulting curve fluctuates between values of zero and “1”. However, some variants of the indicator have a “100” and a zero scale, as well as “100” versus “-100” on some charts. The indicator typically has lines drawn at the “0.30” and “0.70” values as warning signals. Values exceeding either boundary are deemed riskier, while values within are considered low risk. Overbought and oversold conditions are imminent when the curve crosses over these boundary lines, respectively.
The key reference points are high and low, especially when respective values approach zero or “1.0”. The “DeM Rollercoaster” tends to work better for longer timeframes, i.e., daily, but as shown, shorter periods can be accommodated. The DeM indicator attempts to convey price exhaustion, but timing is a weakness that can be overcome using another indicator for validation. In the above chart, two overbought and two oversold conditions follow the initial overbought signal and are evident by the various “limit” crossovers.
As with any technical indicator, a DeMarker indicator will never be 100% correct. False signals can occur, but the positive signals are consistent enough to give a forex trader an “edge”. Skill in interpreting and understanding DeM signals must be developed over time. Complementing the DeMarker tool with another indicator is always recommended for further confirmation of potential trend changes.
There are several ways to build a robust trading strategy that involves the unique signalling power of the DeM. The DeMarker is classified as a leading indicator based on how its formula works with market prices. Unlike the popular Relative Strength Index (RSI), the DeM does not rely on closing price points. It looks at the entire trading period for highs or lows, thereby avoiding a bit of the chaos that can distort other indicators. As it bounces back and forth between its extremes, it illustrates the changing tides of both buying and selling pressures.
Unlike other oscillators, DeMark designed his indicator to make comparisons from one time period to the next, based on each pricing cycle’s relative highs and lows. His algorithm was then an “If/Then” kind of computer logic, which delivered a reflection of investor support for each successive moment. As with any indicator, practising trading on a demo system is the best way to learn how to incorporate the DeM into your trading toolbox. Combined with another indicator, it can become a powerful addition to your trading arsenal.
HOW IS THE DEMARKER INDICATOR CALCULATED?
What is the DeMarker indicator formula? DeMark devised four steps for calculating his namesake’s values, which appear to be very complex at first. As complicated as they might appear to be, the computer software will do the heavy lifting for you in real-time in the background on the MetaTrader4 platform, as well as for others. The sequence of steps is as follows:
- Choose a predetermined period “X” (Standard value is “14”, although a value of “8” or “9” tends to be more sensitive).
- Calculate DeMax = High – Previous High if >0, otherwise DeMax = 0.
- Calculate DeMin = Previous Low – Low if >0, otherwise DeMin = 0.
- DeM = MA of DeMax/(MA of DeMax + MA of DeMin).
The unique thing about this indicator is the insertion of zero values into the moving average stream. This process allows the DeM to hover at both overbought and oversold territories while the chosen asset is trending. The value of this unique property can be observed by taking another look at the overview chart depicted in the introduction.
The Bollinger Bands in “Blue” have been added for additional insights. The bands reflect two standard deviations about a centre line, which is a simple moving average, typically of 20 periods. This indicator is often used to gauge how prices are changing based on a measure of volatility. The “Red” exponential moving average reflects changing price values from another perspective.
Now observe how the red line foreshadows pricing reversals ahead of the Bollinger centre line. These forecasts occur when the red line crosses the Blue Bollinger moving average. It is also important to note how the candlesticks hover about the red line on the chart and then cross over to signal an abrupt reversal. If you look down to the DeM after each moving average crossover, then note that the path of DeM has already shifted into the trending direction, the reason why this indicator is said to be leading and not lagging, as with moving averages.
Learning to spot these subtle changes, as the combination of indicators works on your behalf, is best achieved on a demo-trading platform. All technical indicators use previous pricing behaviour to predict the future. None are perfect, but the DeMarker, in conjunction with other indicators, can give you an edge, which is one thing that will lead to successful trading. Practice and gain valuable experience using the DeM, and you will see benefits down the road.
HOW TO USE THE DEMARKER INDICATOR IN FOREX TRADING
The DeM is sometimes referred to as the DeMark trend indicator due to its ability to react quickly to changing market conditions. As can be discerned from the above MT4 chart, the DeM tends to hover either above or below its midline during the presence of a strong or weak trend. The higher or lower it hovers can be interpreted as a gauge of the trend’s strength. Shifts also tend to be swift; when this indicator moves from overbought to oversold status, it is a signal a reversal is imminent.
The DeMarker indicator can then aid the forex trader on when to enter the market and when to close a position. Once a trend has begun, the DeM shifts quickly and then ranges. When it breaks out of one of these ranging periods, it is time to take notice. It is helpful to combine a trend following indicator like a moving average to confirm the DeM signal before reacting to what could be a false alert. Experience with the DeMarker in tandem with other technical indicators can tilt the odds in your favour when evaluating potential trading setup opportunities.