
The Aroon Indicator is a popular member of the Oscillator family of technical indicators. Tushar Chande developed the Aroon Indicator in the nineties to help traders determine the strength of a trend and whether pricing behaviour was favouring a trend or sideways action. Traders use the “Up and Down” indicator lines to judge the power of a trend, as absolute values signify strength, but simultaneous changes reflect a market that has yet to make up its mind.
In this article we will educate you on the usefulness of the Aroon Indicator, focusing on its usefulness in forex trading. You will learn how to interpret it and its advantages, how it’s calculated and a little about its history.
Tushar Chande was born in India in 1958 but spent most of his career in America. He is a professional trader, but he gained fame for his research in the Technical Analysis field and for his innovative indicator systems. He has written several books and scientific articles, but his most acclaimed work is Beyond Technical Analysis: How to Develop and Implement a Winning Trading System. He created the Aroon in 1995. A list of his other creations in the indicator arena includes VIDYA (Variable Index Dynamic Average), Adaptive Stochastic Oscillator, Stoch-RSI, and Dynamic Momentum Index. He has also created several successful asset management companies in his lifetime.
The Aroon Indicator is classified as an oscillator since the values fluctuate between calculated upper and lower boundaries. The indicator chart typically has two lines, an “Up” version and a “Down” version, which simultaneously measures the momentum in either direction. When polar opposites occur, overbought or oversold conditions are at play. The Aroon is also regarded as a leading indicator since it attempts to detect that a change in market pricing direction is imminent.
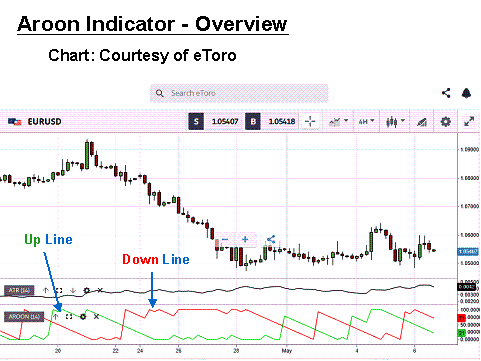
The Aroon Indicator is composed of two fluctuating curves. In the “EUR/USD” 4-Hour example above, the “Green” line is the Aroon “Up” Indicator, while the “Red” line represents the Aroon “Down” Indicator. The weakness in the Aroon is that timing is not necessarily a product of the oscillator. Still, the interpretation of the action of each opposing line can aid in the confirmation of buy and sell signals. Forex traders believe that the most significant value of the Aroon Indicator is in distinguishing if a long-term trend has indeed ended or whether it has stalled.
The critical reference points are high points, low points, and simultaneous positioning relationships. The two Aroon indicator lines behave like a rollercoaster, but the indicator tends to be sensitive to peaks and valleys of future pricing behaviour. It works best in trending waves but is inconclusive during ranging periods. The Aroon oscillator also attempts to convey pricing momentum direction changes. Typical oversold and overbought conditions occur at extremes and are generally confirmed when the opposite indicator line traverses the mid-region at a similar time.
The subtle dance between the two curves can be a challenge to interpret, but practice on a demo system is the recommended way to build confidence with this indicator and learn its nuances. When Chande developed this Technical Analysis tool, he was focused more on the stock world. He suggested a look-back setting of 25 periods, but with the fast-changing pace of the forex market, MetaTrader4 and other proprietary trading platforms have set the default at a standard “14” setting. You may wish to test the Aroon with a “25” setting, but a “14” tends to be more responsive to sudden changes in pricing behaviour.
As with any indicator regimen, the alerts and signals can never be correct at all times. Interpretation skills come with experience, and it is always wise to combine your effort with confirmation from another indicator to gain supporting insights for your overall decision-making process. We have added the Average True Range (ATR) indicator for this purpose in our overview and examples to follow since it helps telegraph a change in investor sentiment. This information, coupled with directional input from the Aroon, can be an effective strategy.
HOW IS THE AROON INDICATOR CALCULATED?
The Aroon Indicator is based upon the concept that bullish trends will result in higher highs and vice versa for bearish downtrends, using a calculation method more about counting how many new high or low occurrences happen within a specified look-back period. The Aroon is not standard on all MetaTrader trading software releases, but many major proprietary trading platforms include this indicator as standard. This calculation formula sequence involves these straightforward steps:
- Choose a look-back period “N” for the “Aroon Indicator” (Standard is “14”).
- Aroon-Up = 100 * ((N – Number of periods since highest high)/N).
- Aroon-Down = 100 * ((N – Number of periods since lowest low)/N).
Thankfully, software programs do the heavy lifting when it comes to counting specific highs and lows and assembling the data to produce an Aroon Indicator, as displayed in the bottom portion of the above overview chart. The look-back period setting for this depiction of the Aroon is “14”, more appropriate for forex trading than Chande’s proposed “25” setting.
This computational work shows that strong trends occur when the respective curve hovers near the “100” mark while the opposing curve falls to near zero. When the curves intersect, it is interpreted as a “Buy” or “Sell” signal, depending on which curve takes the lead. If the “Up” or Greenline is rising, then a shift to an uptrend is in progress. When the “Down” or Redline rises toward the 100 level, it is time to consider shorting your chosen asset. The latter situation is illustrated in the overview chart, i.e., a strong downward trend formed in the first half of the chart.
USING THE AROON INDICATOR IN FOREX TRADING
The Aroon indicator explained is something different in that the trader must observe the dance between two distinctly separate curves and then interpret if the opportunity suggested is worthwhile. For the experienced trader, there is a wealth of information revealed by the Aroon, the reason the indicator remains in favour. Here are just a few of the high points that will help you:
- determine when new trends, whether up or down, are forming.
- gauge the strength of the trends as they develop.
- determine if the market is consolidating or preparing to break out.
- anticipate potential market pricing reversals.
For the Aroon, the excitement begins when the two curves decide to exchange positions. The shift is quick, indicating that a new trend is in formation. The longer each curve hovers in the extremities of the indicator space, the longer you are advised to hold onto your position. When the two curves keep flipping back and forth, the market cannot make up its mind. Ranging behaviour is at hand, but a breakout will happen. When will the market reverse back to a trend? The trader need only wait for a dramatic shift in the positioning of the Aroon curves.
Let’s revisit the overview chart. There is an early up-tick trend, followed by a strong downdraft. The curve crossover in the middle of the chart signifies the ending of the previously strong movement. The ensuing choppiness is symbolic of a return to ranging behaviour. At this stage in the story, traders are patient and waiting for the Aroon to predict a significant breakout. In the example above, no shift was forthcoming, but, at some point, the market will shift.