
The moving average convergence divergence indicator, or MACD indicator, was invented by Gerald Appel, a stock analyst from New York, in 1979. Although this indicator was originally developed for stock trading, it works just as well in any market, including forex trading.
All technical indicators used in trading generally fall into five categories: trend, mean reversion, relative strength, momentum, and volume indicators. The MACD indicator falls under the momentum category and is considered a trend-following indicator.
In this article, we will look at how the MACD indicator is used and how to trade with the MACD indicator. We will also outline a simple MACD trading strategy and how traders could benefit from adopting this indicator when forex trading.
HOW IS THE MACD INDICATOR CALCULATED?
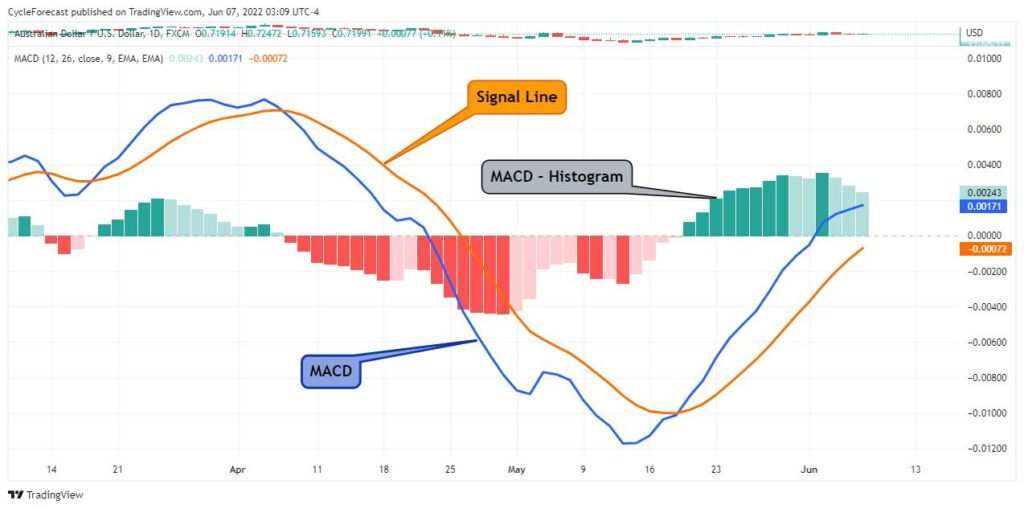
Image for illustration purposes only
The MACD indicator consists of three main components:
- The standard MACD line (blue line on chart), which is derived from subtracting a 26-period exponential moving average (EMA) from a 12-period EMA.
- A signal line (orange line) that is plotted next to the MACD line using a nine-period EMA.
- A MACD Histogram (green and red bars), which is plotted above or below a zero line whenever the signal line crosses the MACD line.
Although the calculations used to draw the individual parts of the MACD indicator might appear confusing, it is more important to focus on how this indicator is used in trading, rather than getting caught up in how and why these calculations are used.
The chart image used above displays the default settings of the MACD indicator, and most trading platforms will automatically open the indicator with these settings when applied to your chart. Next, we will look at how the MACD indicator is used in forex trading, followed by a simple MACD trading strategy with many examples.
HOW TO USE THE MACD INDICATOR IN FOREX TRADING
The MACD indicator is a trend-following momentum indicator, and a lot of valuable information can be obtained from it during a trending market phase. There are two main signals that traders look out for: trend continuation signals and momentum divergence signals.
1. TREND CONTINUATION SIGNALS
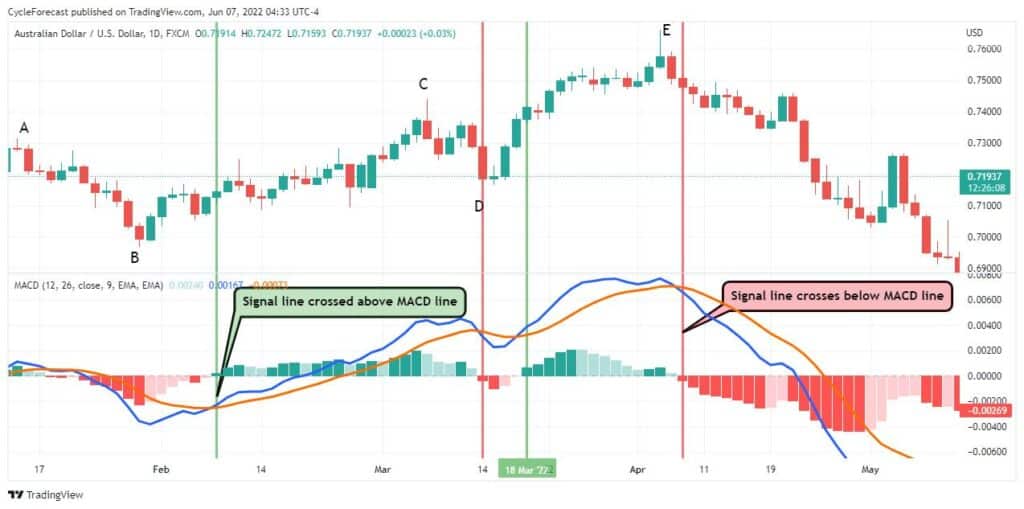
Image for illustration purposes only
The chart image above shows instances where the orange signal line crossed above and below the blue MACD line during an uptrend. For illustration purposes, green and red vertical lines were drawn on the chart at the areas where these crosses occurred.
Following the example above, from left to right, price moves lower from point A to B, but when the signal line crossed above the MACD line, a new upward trend started. This was the first early signal that traders would typically look out for when opening buy positions.
After point C, a correction lower occurred, and the signal line eventually crossed below the MACD line. This signalled a potential change in trend, warning traders that they might want to consider taking profit or tightening their stop losses.
Soon after point D, the signal line crossed above the MACD line again, signalling the first true trend continuation signal, which offered another opportunity for traders to join the uptrend.
At the final high (point E), price reversed lower and was soon followed by a bearish MACD crossover signal – from where a new downtrend started.
The trend continuation signals shown above offered excellent entry opportunities during an uptrend, but on their own, they did not offer any early warning signs that a major trend reversal was about to happen at the final top (point E).
As this indicator consists of three components, it is crucial to understand what each component is telling you. Just before the final high at point E, the MACD Histogram started showing early warning signs that the upward trend was losing momentum, which brings us to the second important signal: momentum divergence.
2. MOMENTUM DIVERGENCE SIGNALS
During the initial phases of a trend, momentum tends to increase, but as a trend nears an end, momentum tends to get weaker. When price continues to move in one direction but the momentum at which price is making new highs/lows starts decreasing, we call this phenomenon momentum divergence.
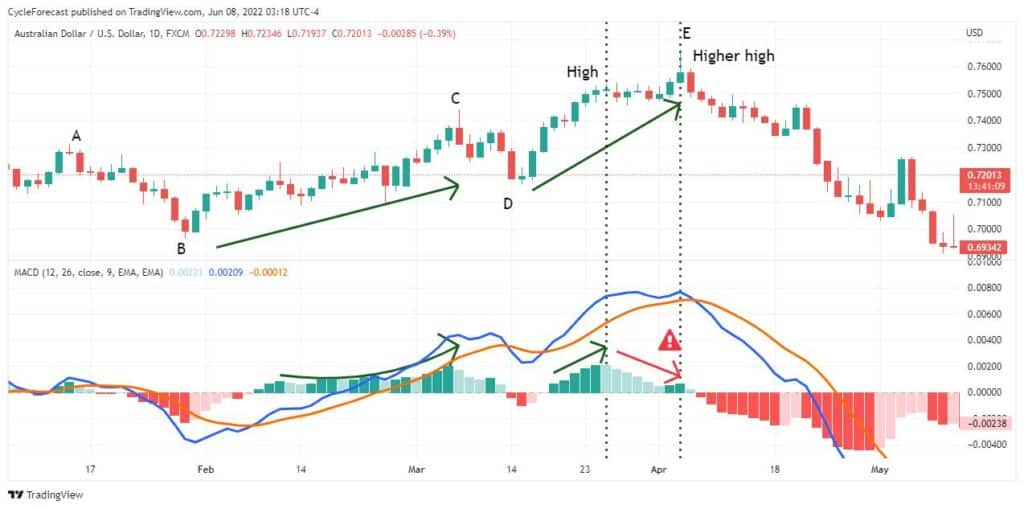
Image for illustration purposes only
Using the same chart image as before, note how the MACD Histogram started plotting larger and larger green bars during the initial phases of the uptrend, showing an increase in momentum (point B to C).
From point C to D, however, there was a decrease in momentum and the MACD Histogram plotted shorter green bars that eventually turned red for a short while when the signal line crossed below the MACD line. This is common during a corrective phase, but the upward movement in price, before the correction occurred, showed no signs of decreasing momentum, and therefore no momentum divergence.
The first warning sign that the uptrend was running out of momentum happened between the two black vertical lines on the chart above. As price continued to make higher highs, the momentum at which price was moving higher severely declined (red arrow with a warning sign on the MACD Histogram). This time, momentum divergence was clearly showing up before the final high.
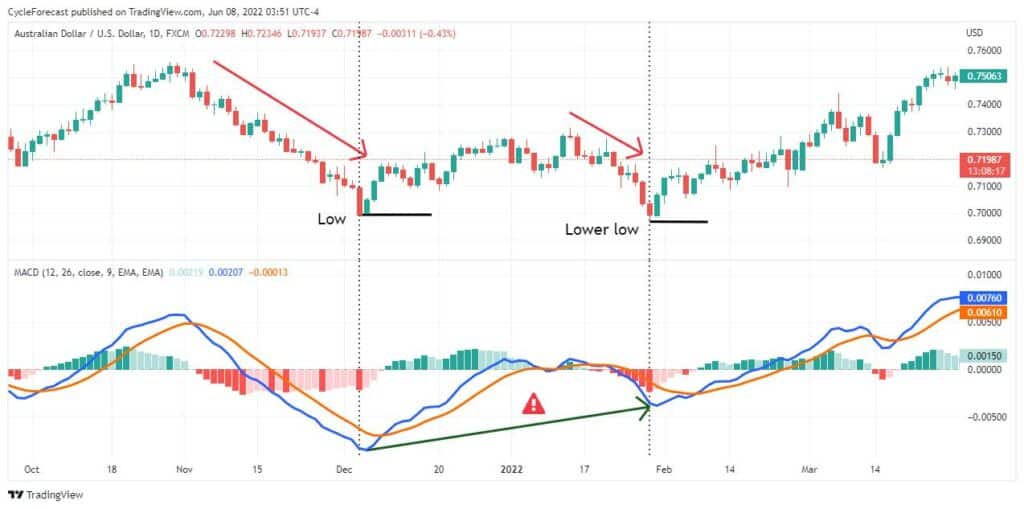
Image for illustration purposes only
Traders should also keep a close eye on the slope of the MACD and signal lines between lows or highs. The example above shows clear momentum divergence between a low and the following lower low with steep upward sloping MACD and signal lines.
Momentum divergence can therefore show up on the MACD Histogram or be detected by the slope of the MACD and signal lines, between consecutive lows and highs.