
Fibonacci was the nickname given to a talented Italian mathematician named Leonardo of Pisa. He lived during the Middle Ages and was the first person to introduce the Western World and Europe to a special sequence of numbers. These numbers appeared in his book Liber Abaci (The Book of Calculation), which he wrote in 1202. Today these ratios are known as Fibonacci ratios, with the most popular ratio being 1.618 or the inverse of that, 0.618. Mathematicians and scientists refer to this number as the golden ratio.
Not only do Fibonacci ratios work in nature, but they are also widely used in trading and form an important part of a trader’s technical analysis toolset. This article will look at how traders typically use these Fibonacci ratios and how they can form part of a trading strategy.
HOW ARE THE FIBONACCI RATIOS CALCULATED?
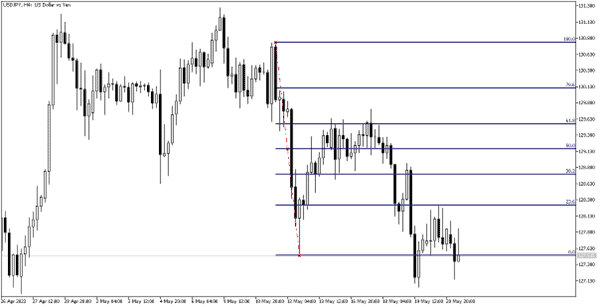
The most commonly used Fibonacci ratios are 23.6%, 38.2%, 50.0%, 61.8%, 78.6%, and 100%. These ratios are automatically calculated by the MetaTrader4 platform, as shown in the chart image below.
Source MQL5
Simply select the Fibonacci indicator from the MetaTrader4 toolbar and use your mouse to click and drag the beginning to an ending point of a previous trend. A series of lines with the corresponding Fibonacci ratios will automatically appear on the chart (blue numbers above the lines on the right-hand side of the chart).
The Fibonacci indicator automatically divides the range you selected into Fibonacci ratios.
HOW TO USE FIBONACCI RATIOS IN FOREX TRADING
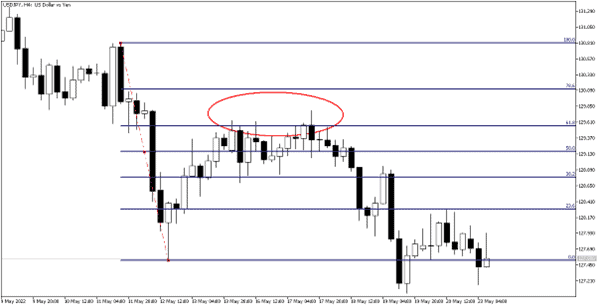
Traders typically use the Fibonacci technical indicator to determine support or resistance levels during a counter-trend reversal (Fibonacci retracement levels) and to predict the direction of future price movement (Fibonacci extension levels).
Source MQL5
The chart above shows a counter-trend reversal that found strong resistance at the 61.8% Fibonacci retracement level before the downtrend continued.
During a retracement, traders will often keep a close eye on the 61.8% Fibonacci ratio, which is related to the golden ratio from where reversals often occur. Keep in mind that the other Fibonacci ratios are also important, and whether they are reached or not will greatly depend on the strength or weakness of the market you are analysing.
Source MQL5
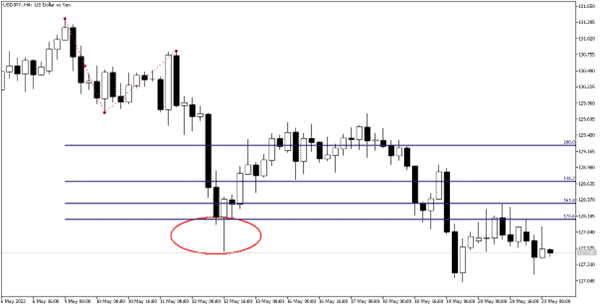
The chart above shows how the Fibonacci extension tool can be used, but, in this scenario, a trader needs to select three anchor points on a chart to draw the Fibonacci extension ratios. For example, the starting point of a downtrend was selected, followed by a low and lastly, a lower high.
MetaTrader4 then automatically projected the Fibonacci extension ratios below the three selected anchor points, i.e., 100%, 138.2%, 161.8%, and 178.6%.
Fibonacci extensions are typically used to determine where a trending market might find support or resistance. Traders often use these extension ratios to judge where they should place their targets or take partial profit.
In this example, price hit the 1.786% Fib ratio, after which a correction occurred. During strong trending market conditions, Fibonacci extension levels beyond the 1.786% ratio can also be used (see final article image example).