Trying to predict the future price of securities, be it stocks, currencies, options, or commodity futures, is not an easy task. Investors look to fundamental analysis to try and gauge the actual value of a security; however, traders often turn to technical analysis to complement their research and help time their trades better. There are several types of technical indicators: trend, momentum, volume, volatility, and support/resistance. They are used to predict different markets and are each best suited to different circumstances. Few technical indicators are more suitable for predicting and timing volatile markets than the Commodity Channel Index indicator (CCI). In this article, we will take a look at how it is calculated, how to use it in forex trading, and provide a simple CCI indicator trading strategy to help improve your trading arsenal.
HOW IS THE CCI INDICATOR CALCULATED?
CCI calculation is relatively straightforward and involves several short steps. Here is the formula for the CCI indicator:
- CCI = (Typical Price – MA) / (0.015 × Mean Deviation)
We can calculate the values of CCI in a 7-step process:
- Determine the number of periods the CCI indicator will cover and provide a numeric figure. Most trading software takes 20 trading periods as the default setting; however, it can be changed to your liking. More periods will result in a smoother CCI indicator, whereas fewer periods will result in a more volatile CCI. Once you have chosen the number of periods, continue using that number for the remainder of the CCI calculation. For this calculation, we will assume 20 periods as our basis. You will, in total, need to have at least twice the number of periods worth of data to compute CCI indicator values.
- To calculate the CCI indicator, you will need to find High, Low, and Close price data for your security of interest (it is best to paste the data into a spreadsheet with High, Low, and Close prices in separate columns). Once you have the required data, compute the Typical Price by calculating the average of High, Low, and Close prices for each 20 periods.
- Once you have the Typical Price for at least 20 periods, calculate the Moving Average (MA) of the Typical Price totalling the last 20 prices and divide the result by 20.
- Calculate Deviation by subtracting the Moving Average (MA) from the Typical Price for the last 20 periods.
- Calculate the Mean Deviation by summing the last 20 absolute Deviation values (without the – signs) and then divide the result by 20.
- You should, by now, have arrived at the Typical Price, Moving Average (MA), and Mean Deviation values for at least one time period. You can now use the CCI indicator formula to compute CCI values.
- You can repeat the process for any new periods by simply dragging down the formulas in the spreadsheet.
The 0.015 constant is simply a statistical adjustment to make most of your CCI values fall between -100 and 100.
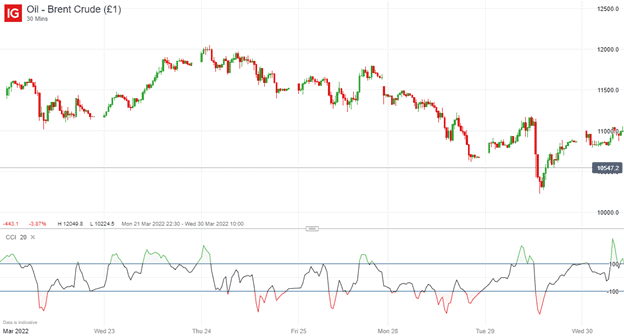
The indicator is usually portrayed at the bottom of your trading chart in most trading software, with two highlighted horizontal lines with values of 100 and -100. The CCI values over 100 are often drawn in green (meaning overbought), whereas values below -100 are usually in red (meaning oversold). Here’s the CCI in action on a continuous Brent crude oil futures contract: