
Are you looking for a technical trading tool that takes basic candlestick formats and then enhances them to provide a more coherent visual image? There is one trading system that does just that, and it is known as the Heikin Ashi Indicator. If you wish to know more, read on and learn how this unique technical tool is calculated, how you can use it in forex trading, or use it to incorporate a simple trading strategy within your daily routine. lastly, how a real-time forex trading example demonstrates its effectiveness.
The Heikin Ashi indicator is an application that has gained popularity recently after being relatively unknown. It was rediscovered a few decades ago as an improvement upon the interpretation of Candlestick formations, which have been studied for centuries, starting with rice merchants in Japan in the 1700s. Heikin Ashi is said to remove the “noise” from candlesticks and behave much like a moving average. Traders use Heikin Ashi to determine a trend’s relative strength and pinpoint key turning points in price behaviour.
The origin of this indicator goes back to the 1700s in Japan, where Munehisa Homma is given credit for its creation. As a rice merchant, he was an avid trader in rice markets. He is not only known for the Heikin; he has also been called the “God of Markets” and is often named the father of candlestick formations. He wrote one of the first books about the psychology of markets, emphasising that understanding investors’ emotions are critical to trading successfully in rice commodity markets.
Since that era, many books have been written about market and investor psychology and the interpretation of candlestick formations. As with other aspects of Japanese culture, candlesticks and the Heikin do not easily give up their deeper secrets. A trader can react to superficial observations or invest time in active practice sessions to dig deeper into how these tools can improve trading prowess. Read on to learn more.
HOW IS THE HEIKIN ASHI INDICATOR CALCULATED?
The Heikin Ashi indicator application tool takes the basic candlestick information, the open, close, high, and low, and then “smooths” the erratic portions of the chart in much the same fashion as would a moving average. Traders can then make a better-informed decision without the distractions caused by volatile price action.
A key benefit of the Heikin Ashi indicator is its visual simplicity. Trading channels appear more tightly formed, and major trends are easier to detect and follow. However, it is highly recommended that the use of Heikin Ashi be combined with another indicator to confirm interpretations.
The Heikin Ashi indicator is common on MetaTrader4 trading software, and the calculation formula smooths pricing information by averaging as follows:
- Close = (Open Price + High + Low +Close) / 4
- Open = (Average of Open Price and Close Price of the previous bar)
- High = (Maximum value of the (High, Open, Close))
- Low = (Minimum value of the (Low, Open, Close))
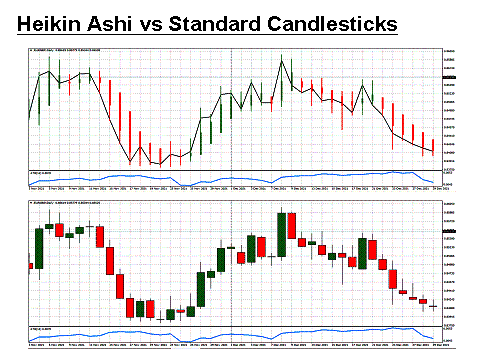
Software platforms generally place the Heikin Ashi indicator as an overlay of existing candlestick formations or separately, as depicted in the above comparison. In the combination chart example above, the Heikin Ashi “bars” are either Green or Red with noticeable size differences from the standard candlesticks presented on the bottom half of the graphic. The line connects closing prices for each day. Although it may take time to become familiar with the new chart presentation, one can immediately recognise the price momentum building on each leg of the rollercoaster ride depicted for the daily “EUR/GBP” currency pair for the latter part of 2021.