
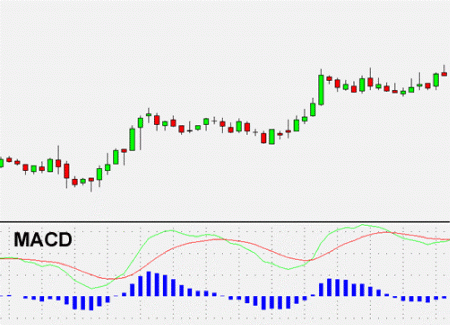
Moving Average Convergence-Divergence Definition. Moving Average Convergence-Divergence, or “MACD”, is a common technical indicator used by forex traders to detect and confirm trends in price behavior of their target currencies. It is a lagging indicator as it reacts after a trend has formed. The MACD uses two different exponential moving averages of prices. Parameters are variable, but the typical settings are 26 days or periods for one EMA and 12 days or periods for the other EMA. The “fast line” is then the moving average of the difference of these two lines. A “slow line” or “signal line” is the moving average of the difference between the “fast line” and a 9 day or period EMA. Occasionally, a bar chart called the MACD histogram may be added to visually indicate entry and exit signals. The chart below illustrates how the MACD looks and operates. Forex traders look for crossovers of the two lines as a signal of a bullish or bearish trend. When the “green line”, or MACD, diverges from the “red line”, or signal line, the indicator is signaling overbought and oversold conditions, respectively. The MACD is often used in combination with a leading indicator, typically the RSI or Reserve Strength Index, to confirm a signal before entering a trade position.
Risk Statement: Trading Foreign Exchange on margin carries a high level of risk and may not be suitable for all investors. The possibility exists that you could lose more than your initial deposit. The high degree of leverage can work against you as well as for you.